
Municipal elections in the Netherlands, 13 March 2022
Alexander Verdoes
PhD candidate at University of Bergen


Issue
Issue #3Auteurs
Alexander Verdoes
Issue 3, March 2023
Elections in Europe: 2022
On the 16th of March 2022 municipal elections were held in the Netherlands. A total of 333 out of 344 municipalities elected a new municipal council. Elections were not held in 11 municipalities because “reform” elections were, or will, be held. Every four years, in March on a Wednesday municipal elections are held in all municipalities simultaneously. Due to the COVID-19 pandemic it was also possible to vote two days prior to the official election date. The report is divided in three parts. First will the organisation of Dutch municipalities be described. Second, will the campaign be discussed. Finally, the election results will be discussed. The 2022 elections can characterised by three striking results: a record low turnout, a record high vote share won by local parties, and an all-time high fragmentation of the municipal councils.
The organisation of Dutch municipalities
Dutch municipalities are far from stable polities, as municipalities are subject to frequent territorial reforms. Until the 1950s, the number of municipalities was relatively stable, and there were more than 1,100 municipalities. Since then, the number of municipalities has gradually declined due to municipal mergers. In 2022, the Netherlands counted 344 municipalities. The organisation and competences of the municipalities are organised by the municipal law. All Dutch municipalities have the same responsibilities. The main responsibilities for municipal councils are spatial planning and development, housing, culture and recreation, local infrastructure, public health, primary schools, and since 2015, due to a decentralisation, municipal councils are also responsible for social welfare, child protection, and employment and reintegration of the unemployed on the labour market. In addition, the mayor is responsible for public order and safety.
The size of the municipal council depends on the population and ranges from nine members (in municipalities with fewer than 3,000 inhabitants) to 45 (in municipalities with more than 200,000 inhabitants). The number of full-time aldermen
1
is at least two and no more than 20% of the number of councillors (i.e., nine in the largest municipalities). More aldermen can be appointed if they take up a part-time position.
During the elections, voters have one vote that they cast on one of the candidates who appear on the lists. The votes for the candidates are subsequently aggregated in the list on which the candidates appear. For the allocation of seats, the municipality forms one single electoral district. Each list obtains as many seats as it is proportionally entitled to following the Hare quota.
2
There is no legal electoral threshold. There is, however, a natural threshold that ranges between approximately 10% of the votes in the smallest municipalities, to about 2% of the votes in municipalities with more than 200,000 inhabitants. List seats are subsequently distributed to those candidates who obtained 25% of the electoral quota (50% in municipalities with fewer than 19 seats). In case not all seats can be allocated to candidates based on obtained preference votes, then those unfilled seats are allocated based on the list order.
After the election, a new municipal executive (College van Burgemeester en Wethouders) is formed that is composed of the mayor (burgemeester) and the aldermen (wethouders). The mayor has a special position as she is appointed for a six-year term, and can only be revoked, by the central government. The mayor chairs the municipal council but is not its member officially. The mayor is also the head and a full member of the executive. The aldermen in the executive are elected by, but not necessarily among, the members of the municipal council. In practice, this appointment happens after a coalition formation process, as single party majorities are rare, and even then, sometimes oversized coalitions are formed. In this process, parties negotiate a common government program that has the support of a majority in the council. However, because of the fragmentation of the councils, coalition formation can be a complicated process. A solution to this, that has become more common recently, is a “council-wide agreement” that is supported by (almost) all parties in the council.
The campaign
Electoral campaigns were relatively local during the 2022 elections. The campaigns were extensively covered by local and regional media outlets. In addition to canvassing, it was also common to organise an election debate with local candidates on local topics. Salient local issues were often local development plans. In Zeewolde, for example, a local party (Leefbaar Zeewolde) that strongly opposed the construction of a data centre in the municipality won a majority of the vote in the elections. Another common theme in most municipalities was the housing crisis and accessibility to the affordable housing. Whether most voters were aware of these local campaign activities is another question, as interest in local politics is rather low (Den Ridder & Dekker 2019, p. 34).
Even though voters might not follow local politics, municipal elections usually receive considerable attention from the national media, and national politicians are generally visible during municipal election campaigns. However, this was different during the 2022 election, as attention from the national media and the visibility of national politicians remained rather limited. This can be explained by the outbreak of the war in Ukraine that dominated the news during the campaign period. Illustrative of this is that Prime Minister Mark Rutte of the Party for Freedom and Democracy (VVD) attended a talk show in the context of the municipal elections. Rutte, however, had to leave during the live broadcast because the situation in Ukraine was escalating.
The results
In short, the elections revealed three striking outcomes. First, turnout in municipal elections reached its all-time low. Second, local parties obtained an unprecedented high vote share, and became the most prominent party, meanwhile most national parties presented themselves as “winners.” Third, local party systems have never been so fragmented.
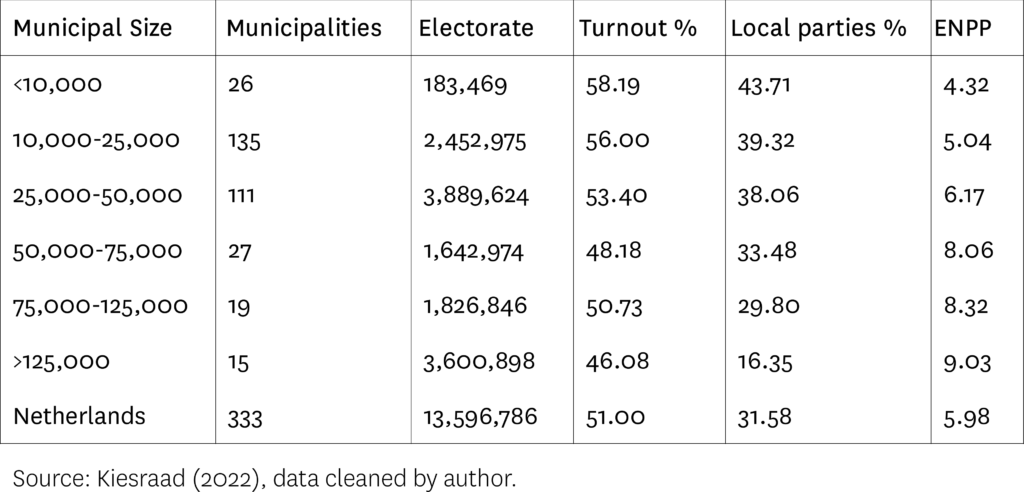
First, turnout in municipal elections declined and reached its all-time low, as only 51.0% of the electorate showed up at the polling station. This is a 4-percentage point drop, compared to the previous 2018 municipal elections. This was somewhat unexpected, as turnout was quite stable between 2002 and 2018, when it fluctuated around 55%. If we look at the turnout more closely, we see that turnout is primarily low in the larger municipalities (see Figure a). While turnout in the smallest municipalities is the highest (58.2% on average), the average for the largest municipalities is only 46.1%. An explanation for the low turnout in this specific election could be that the national media attention was limited for the municipal elections. Consequently, voters might have been less aware of these elections, and/or perceived the local elections as unimportant. It is, however, unwarranted to speak of a crisis in turnout, as turnout for national, provincial, and European elections has actually increased in the last decade.
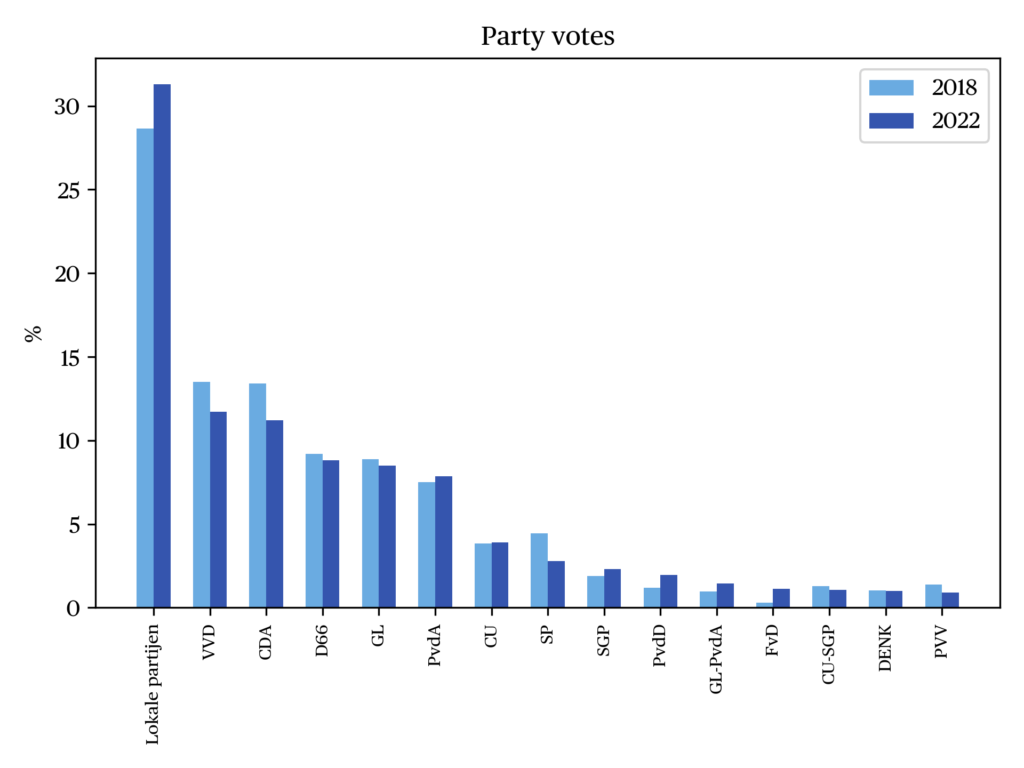
Second, local parties became most prominent and grew even further, compared to the 2018 municipal elections. Local parties are parties that compete in one only municipality. In addition, these parties are not related to any national political party. Note that in many municipalities multiple local parties competed, in which case the votes for local parties are aggregated. While local parties obtained about 11.7% of the votes in the 1986 municipal elections, their vote share gradually increased during the 1990s, especially after the emergence of the Liveable (Leefbaar) movement (Van Ostaaijen 2012). In 2002, the local parties became for the first the time the plurality party as they obtained 25% of the votes. While in 2018 the local lists obtained an all-time high of 28.7% of the votes. This result was further improved in 2022, when local parties obtained a total of 31.6% of the votes. To understand the success of local parties one has to consider both the supply side (the parties that compete) and the demand side (what voters want).
From the demand side, we can understand the support for local parties because of political distrust. Voters who are dissatisfied with national, or local, politics, often vote for a local party. They do so to express their dissatisfaction with mainstream politics (Otjes 2018: 318-319; Otjes 2020: 103). Often, these local lists also find their origin and appeal to dissatisfaction with how the municipality is governed by the local branches of national parties (Van Ostaaijen 2012: 206). From this perspective, voting for local parties can thus be understood as a protest vote. Another demand side explanation is that local parties appeal to voters because local parties are better capable of defending local interests and/or appeal to a local identity. If this is the case, then voting for local parties is not a protest vote, but a local vote (Otjes 2018: 320).
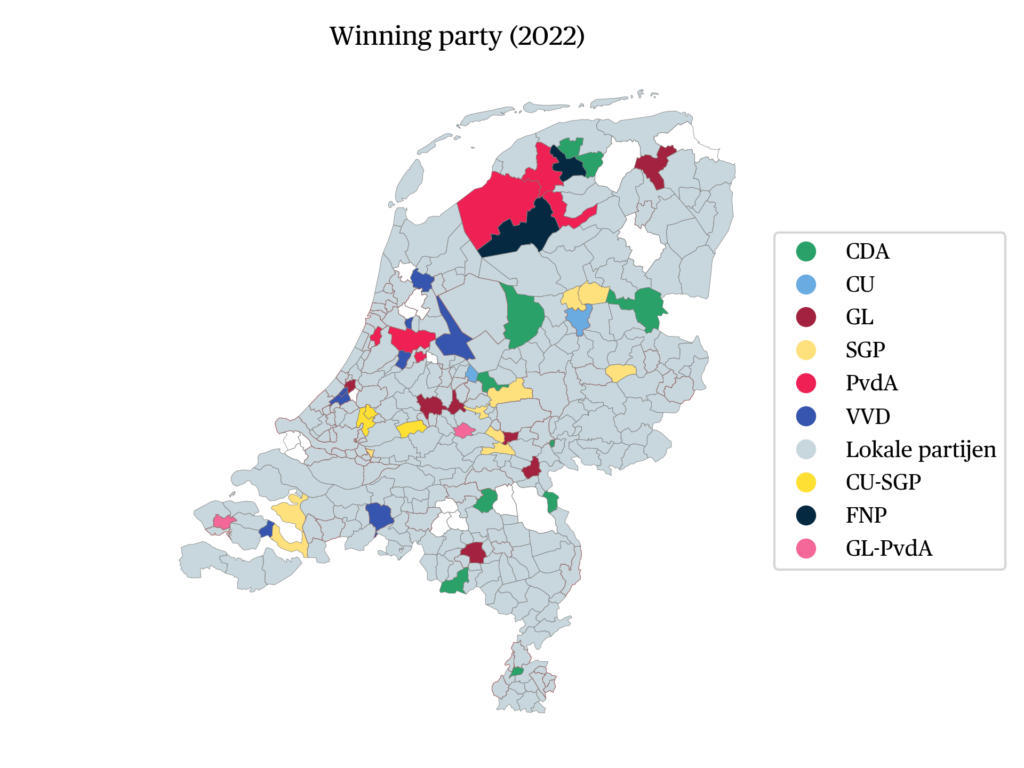
From the supply side, the success of the local parties can be explained by the fact that not all parties that are represented in national parliament appear on the ballot in all municipalities (see Figure b). In almost all municipalities, voters could cast their vote for a local party, the VVD, or the CDA. Meanwhile, other parties that won a seat in the 2021 national elections only competed in a limited number of municipalities, often only in the more populated municipalities. Many voters could thus not vote for their preferred party and might have cast their vote for a local party instead (Otjes 2020: 103). Preliminary evidence for this is that in larger municipalities where most national parties compete, local parties obtained a smaller vote share. And relatedly to the distrust argument, many parties (e.g., SP, FVD, PVV, JA21, BBB) that do not compete in most municipalities, mobilise their voters based on a populist sentiment (Otjes 2020: 320). Local parties seem like a natural substitute for these voters, as many local parties also appeal to dissatisfaction with national political parties. Local parties could thus have benefited from the limited coverage of the many parties that are represented in national parliament.
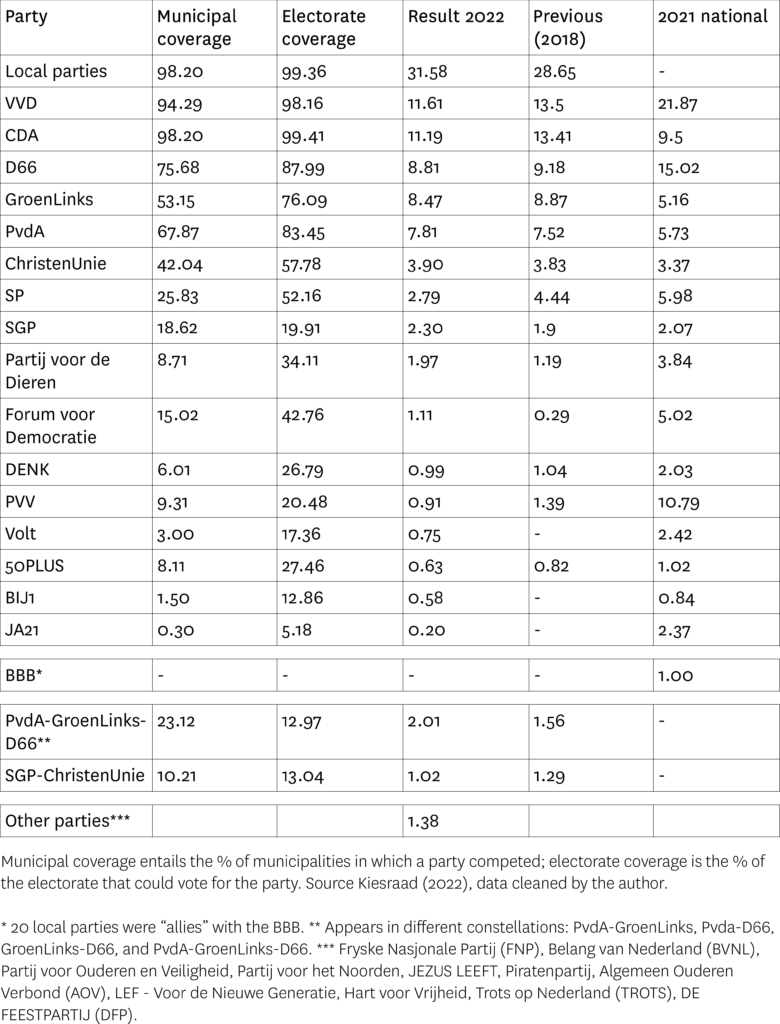
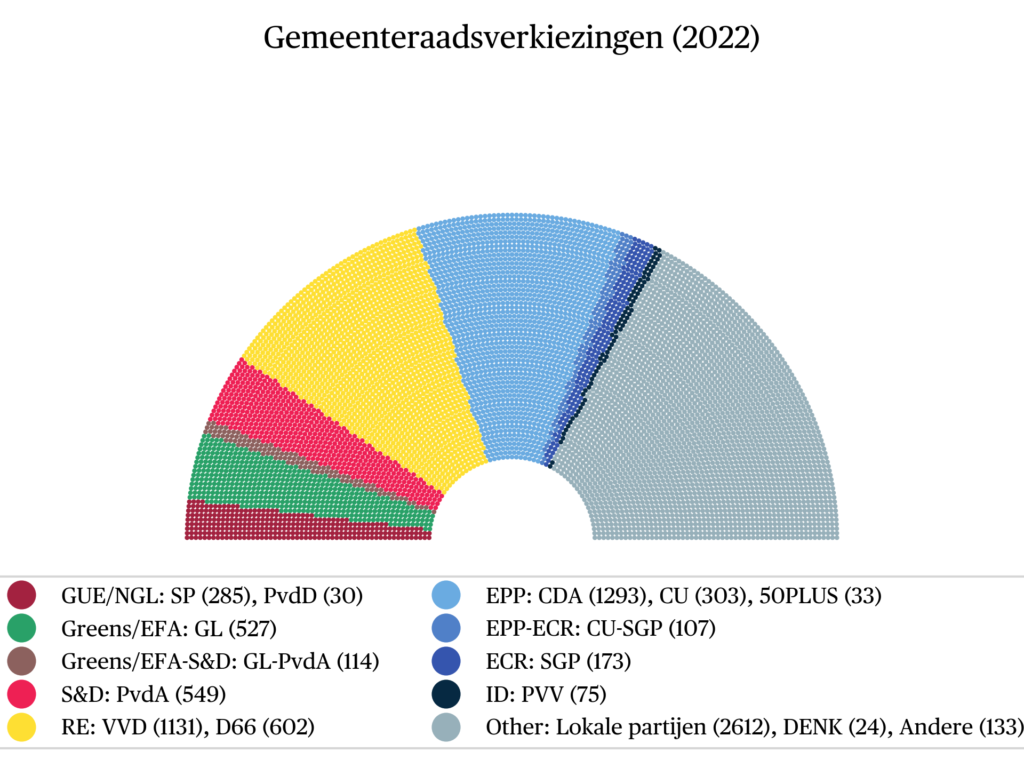
Even though the local parties clearly are the winners of the elections with a record of 31.6% of the votes, most national parties have also declared themselves as winners. The VVD presented itself as the national party with the largest vote share even though it lost many votes in comparison to the previous municipal and national elections. The Christian Democratic Appeal (CDA) became the national party with the most seats in the municipal councils. GreenLeft (GroenLinks) both obtained a record high vote share and record number of seats for municipal elections. The Labour Party (PvdA) became the largest party in the capital Amsterdam. Forum for Democracy (Forum voor Democratie) entered the municipal council in an additional 48 municipalities. While many other parties did better than expected compared to national election polls.
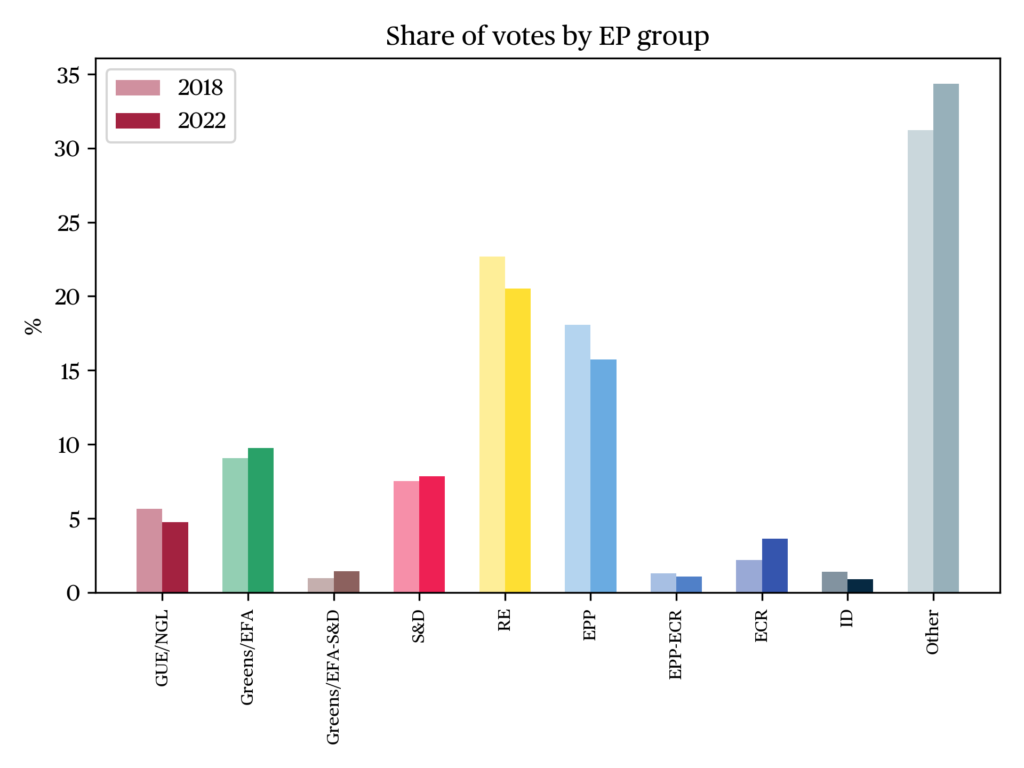
The interpretation of the election results (see Figure b) is, however, more difficult than it appears. First, it must be noted that these are aggregated results. The extent to which voters switch their vote is thus underestimated, as individual level vote switching can be cancelled out on the aggregated level. Similarly, the municipal results are aggregated to the national level. Consequently, vote swings at the municipal level can be cancelled out on the national level, as a party might win votes in one municipality, but loses in another. Second, one must choose a reference point which can either be the previous (2018) municipal election, or the previous (2021) national election. Both comparisons are difficult because the supply of parties’ changes over time. The Socialist Party (SP), for example, competed in 111 municipalities in 2018, while in 2022 it competed in 87 municipalities. At the same time, the SP lost 1.7 percent points in nationwide vote share. It is difficult to interpret this loss because some voters might have deliberately voted for another party. Meanwhile other voters could have wanted to vote for the SP, but they simply could no longer for vote the SP since it no longer competed. Consequently, these SP voters probably voted for another left-wing party, a local party, or did not turn out. The electoral performance of a party can thus partly be explained by which parties are present on the ballot.’
A comparison with previous national elections is even harder for the same reasons, as the parties that won seats in the parliament appeared on the ballot in all municipalities but their presence in on the ballot in the local election differs from municipality to municipality. Volt, a main competitor for the liberal democratic D66, for example did not compete in most municipalities. The vote loss for D66 could thus have been worse if Volt would have competed in more municipalities. In addition to the differences in supply of political parties, the huge turnout gap of 27.1 percentage points between national and local elections makes it difficult to compare the results on the aggregate level.
The final observation is that Dutch party system remains highly fragmented. While in 2018 there were on average 5.8 effective number of parties represented in the municipal councils. This fragmentation increased further in 2022, when on average 6.0 effective parties were represented in the municipal councils. Again, we see a positive correlation with municipal size (Figure a). There are three related explanations for this positive relation. First, in the smallest municipalities on average only 5.3 lists competed, while in the largest municipalities on average 17.1 lists competed. Relatedly, the natural threshold in larger municipalities is lower, so it is relatively easier for parties to win a seat in larger municipalities. Finally, larger municipalities are often more socially diverse. Which is reflected in a more heterogenous party system as parties can exploit these more heterogeneous political preferences. In addition, it is easier for parties to find local candidates and organise a local campaign as there is simply a higher number of supporters in more populated municipalities.
Fragmentation of the party systems complicates the coalition formation process, as it becomes more difficult to form, feasible, majorities. In the 2022 elections, there were only five municipalities where one single party obtained a majority of seats, while in 123 municipalities at least two parties will be needed to form a majority. In 151 municipalities, at least three parties are needed to form a majority, and in the remaining 54 municipalities at least four parties are needed to form a majority in the council. This leads to a complex coalition formation process, and at the time of writing (late May 2022), coalitions have been formed in only 130 municipalities. For comparison in 2018, about two months after the elections 233 local governments were formed, while in 2014 virtually all municipalities had their coalition in place two months after the elections (Van der Parre 2022). Explanations for these long formation processes, besides fragmentation, are the strength of anti-establishment parties, turnover of councillors, and municipal size (Otjes et al. 2021).
In addition to these three main arguments, it is worth noting that more female representatives were elected in the municipal councils. As the share of female representatives increased from 32% in 2018 to 37% in 2022. This is similar to the percentage of women in national parliament (38%), and higher than in provincial assemblies (33.2%). In The Hague the local party Groep de Mos/Hart voor Den Haag and in Roermond the local party Liberale Volkspartij Roermond became the largest parties, while the leaders of these local parties were under investigation (The Hague) or convicted for corruption (Roermond). Meanwhile, in 2018 in the municipality of Barendrecht, the local party Echt voor Barendrecht fell one seat short of an absolute majority, but it was nevertheless excluded from the government coalition. In 2022, the party won a staggering 20 out of 29 seats.
Local election surveys that have been conducted around the 2022 elections can further enlighten our understanding of these local elections. Which voters did not turn out, and what reasons did they have to stay at home: did their preferred a party that did not compete, was interest in local politics lower than usual, or maybe some voters were afraid of COVID-19. Individual level evidence can also further our understanding of the extent of vote switching, which voters changed their vote compared to the previous national and local elections, and why so many voters voted for a local party.
References
Den Ridder, J., & Dekker, P. (2019). Lokale (en) politieke betrokkenheid en participatie. In Jansen, G. & Denters, B. (eds.), Democratie dichterbij Lokaal Kiezersonderzoek 2018: 31-41.
Kiesraad (2022). Alle uitslagen van gemeenten. Online. Retrieved 22.5.22.
Otjes, S. (2018). Pushed by national politics or pulled by localism? Voting for independent local parties in the Netherlands. Local Government Studies, 44(3): 305-328.
Otjes, S. (2020). Going local. Voting for independent local parties in the Netherlands 1986-2010. Local Government Studies, 46(1): 91-115.
Otjes, S., de Natris, J., & Allers, M. (2021). De duur van formaties en de lengte van college-akkoorden: Bestuurlijke en politieke complexiteit in gemeenten.
Van der Parre, H. (2022, May 20). Gemeenten formeren steeds trager: overgrote deel heeft nog geen nieuwe coalitie. NOS.
Van Ostaaijen, J. (2012). Ondertussen in de lokale politiek. Beeld en Maatschappij, 39(2): 194-212.
Notes
- The term aldermen is used to label the members of the executive (wethouders).
- This quota is calculated by dividing the number of valid votes by the number of seats. Remainder seats are allocated following the D’Hondt method if 19 or more seats are allocated. Otherwise, remainder seats are allocated base on the largest remainders.
citer l'article
Alexander Verdoes, Municipal elections in the Netherlands, 13 March 2022, Oct 2022,
à lire dans cette issue
voir toute la revueEurope, 2022: Democracy in the Shadow of War
The year 2022 will probably go down in history as a year of great violence, of utmost international tension, and of considerable global uncertainty. Not only did Russia’s war against Ukraine bring back mass killings and the specter of a nuclear confrontation on the top of the European agenda. As further evidence of irreversible climate … Continued
lire l'articleRegional election in Andalusia, 19 June 2022
The June 2022 elections in the Autonomous Community of Andalusia resulted in an absolute majority for the PP (Partido Popular), which obtained 43.11% of the vote and 58 of the 109 seats that make up the Andalusian Parliament. These elections also confirmed the decline of the Spanish Socialist Workers’ Party (PSOE) in the region: with … Continued
lire l'articleParliamentary election in Sweden, 11 September 2022
The context of the election The 2022 election was heavily influenced by a turbulent previous parliamentary period, with several simultaneous crises as a backdrop. This turbulence is indicative of the breakdown of the traditional political blocs and the drawing of new political boundaries. For most of 20th century, Swedish politics consisted of a left-wing bloc, … Continued
lire l'article