
The State of China’s Environment: What Has Changed in the Past Few Years?


Issue
Issue #1Auteurs
Stéphanie Monjon , Léa Boudinet
21x29,7cm - 153 pages Issue #1, September 2021
China’s Ecological Power: Analysis, Critiques, and Perspectives
In 2014, the Chinese Prime Minister Li Keqiang announced that the country would go to “war on pollution with the same determination as the one waged against poverty” and, in 2017, President Xi Jinping declared that he wished to make the Chinese nation an “ecological civilization” before members of the Communist Party Congress. Given these extremely strong pronouncements, it is only fair to wonder what progress has been made since then.
A war against pollution implies reducing all manner of contaminants (emissions, sewage, garbage, etc.) in various environments (air, water, soil). The term “environment” covers a wide variety of environments and ecosystems, and the list of pollutants is particularly long: fine particles, sulfur dioxide (SO2), nitrogen oxides (NO, NO2), CO, ozone (O3), plastic particles, chemical pollutants, lead, cadmium, arsenic, hydrocarbons, benzene, volatile organic compounds (VOCs), nitrates, etc. Protecting the environment therefore requires a whole host of actions to reduce all of these contaminants and ensure the good health of the various ecosystems that are essential to life. Assessing the state of a country’s environment requires implementing numerous oversight systems, processing the data they produce, analyzing, and synthesizing this data. Authorities can then choose to publish this information in a more or less comprehensive manner. However, despite declarations of a new environmental governance based on greater transparency and data disclosure 1 , assessing the condition of various environments in China remains difficult. In addition to the falsification of environmental data that is still regularly discovered in the country 2 , the data is often incomplete, and it is often impossible to monitor it over a period of several years.
In this article, we have brought together several sources offering different insights into the recent state of the environment in China. Far from being exhaustive, the assessment presented here provides some insights into the environmental crisis that the country is still facing.
First evaluation by means of an aggregated index
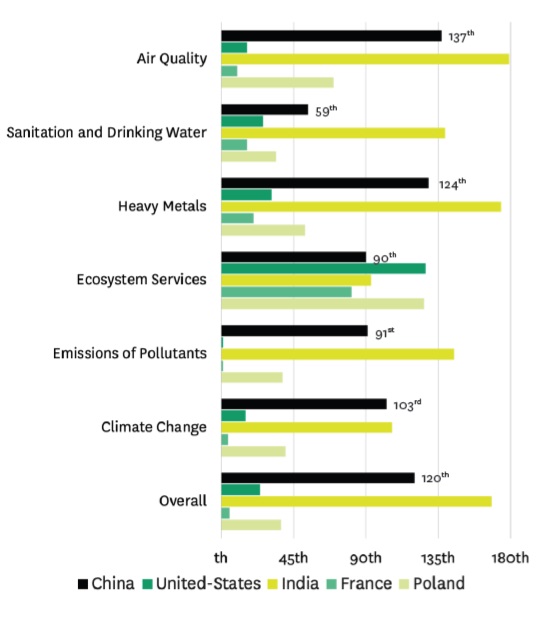
The Environment Performance Index (EPI 3 ), developed jointly by the Yale Center for Environmental Law & Policy and the Center for International Earth Science Information Network (CIESIN) at Columbia University’s Earth Institute, provides an initial comparison of 180 countries. The 2020 Index ranks China 120th, based on data from 2017 or 2018. It includes 32 indicators in 11 categories: air quality 4 , sanitation and drinking water, heavy metals 5 , waste management, biodiversity and habitat, ecosystem services 6 , fisheries, climate change 7 , emissions 8 , water resources, and agriculture. Figure 1 shows the rankings of China, France, India, and Poland for some of the index categories.
While this environmental index has limitations, particularly in terms of data availability and reliability 9 which may lead to questionable choices in the calculation of an indicator, China’s overall position is quite weak: the country is ranked 120th, i.e., last in the second of the three tiers. China’s results nevertheless vary according to the category in question. While China is ranked in the top third for drinking water quality, it is far behind the United States or France in other categories: air quality (137th), emissions (91st), and climate change (103rd).
In the remainder of this article, we examine a small number of environments — air, surface water, and soil — in more detail based on data published by authorities in China.
Figure 1 • ranking of china, the united states, france, india and poland in different EPI 2020 categories
Air pollution in China
In the early 2010s, images of the “airpocalypse” 10 left their mark on international public opinion, and air pollution is certainly the phenomenon which comes to mind when thinking about pollution in China. However, the situation is not the same throughout the country. Air pollution is a relatively localized phenomenon and can be generated by different types of air pollutants; some air pollutants remain close to the sources that emitted them while others are carried by the wind over dozens (or even hundreds) of kilometers, which can lead to the degradation of air quality in areas that are not responsible for this pollution. Other air pollutants are called secondary pollutants, i.e., they are not directly released, but are formed when other pollutants, called primary pollutants, react in the atmosphere. For example, ozone (O3) is formed from hydrocarbons (HC) or volatile organic compounds (VOC) and nitrogen oxides (NOx) that react in sunlight, and NO2 is produced as a result of a reaction between NO and oxygen. Understanding the how and why of air pollution in a city or region requires a detailed knowledge and analysis of the different types of emissions generated within a territory, their movements, and their possible reactions with the atmosphere.
In China, the assessment of ambient air quality by the Ministry of Ecology and Environment (MEE) is based on measuring the concentration of 6 pollutants: PM2.5, PM10, SO2, NO2, O3 and CO 11 . An individual score is given for each pollutant; when the concentration of pollution exceeds a certain threshold, the score increases. The final air quality index is the highest of these scores.
In the 2020 EPI, the “air quality” category contains 3 indicators: population exposure to PM2.5 (55%), household use of solid fuels (40%), and ozone exposure (5%). China is ranked 137th, which is a very bad ranking given the authorities’ efforts on this matter for several years 12 .
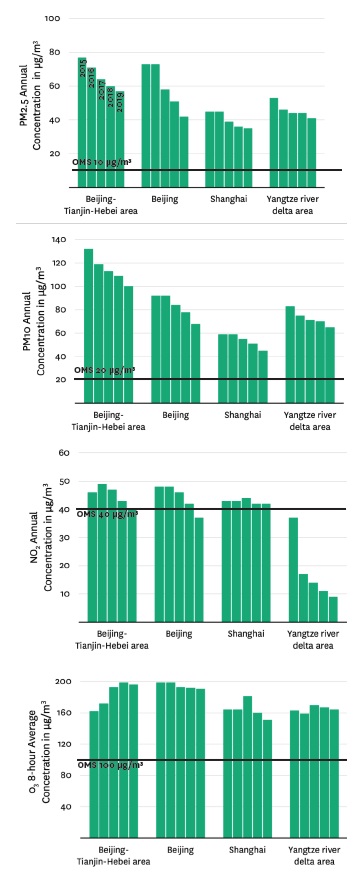
In 2017, the MEE published a ranking of 74 Chinese cities 13 : for 75% of the cities, the largest source of air pollution comes from PM2.5, but the worst ranked cities (Haikou, Lhasa, and Zhoushan) are due to O3 14 . Therefore, depending on the city, the diagnosis can significantly differ. The annual reports published by the MEE make it possible to track the evolution of these 6 pollutants between 2015 and 2019 in Shanghai and Beijing and their surrounding areas 15 . For comparison, the thresholds recommended by the World Health Organization (WHO) are included.
The figure shows significant differences between locations, pollutants, and 5-year trends. For example, ozone pollution in Beijing has slightly decreased (-4% from 2015 to 2019) but has increased by about 13% in the Beijing-Tianjin-Hebei region. For some pollutants, such as SO2 and NO2 emissions, a decrease has been recorded: concentrations show a clear improvement in all 5 areas with an average decrease of 53% and 23% respectively.
Figure 2 • Changes in concentration of the 6 pollutants included in the air quality index for 2 cities and 2 regions in China (2015-2020) 16
The burning of coal is still the biggest source of air pollution in China, especially PM2.5, SO2 and NOx 17 . Since the late 2000s, coal-fired power plants have been equipped with desulfurization and denitrification systems for their flue gas during construction and renovation 18 . These systems reduce SO2 emissions by more than 90%, but only a fraction of NOx and fine particles emissions. Yet coal-fired power plants are still being developed on a massive scale and at an unprecedented rate worldwide. As of February 2021, China has 247 GW of coal-fired power plants under development 19 . While desulfurization equipment can significantly reduce SO2 emissions into the air from coal-fired power plants, CO2 emissions continue to grow at a rapid pace (see next section).
Despite some progress regarding PM2.5 during this period, the Chinese population’s exposure levels are still of great concern in the country. It is estimated that in 2020, 99% of China’s 1.4 billion inhabitants live in areas where the average annual concentration of fine particles is higher than WHO recommendations 20 and 43% live in areas that do not meet Chinese national standards. And the progress made could be fragile: Smart Air, a social enterprise based in Asia, points to an increase in PM2.5 concentration in 8 of the 15 cities monitored between 2018 and 2019 21 . The Chinese “war on pollution” is therefore far from over.
Air pollutants and greenhouse gases: different gases not to be confused
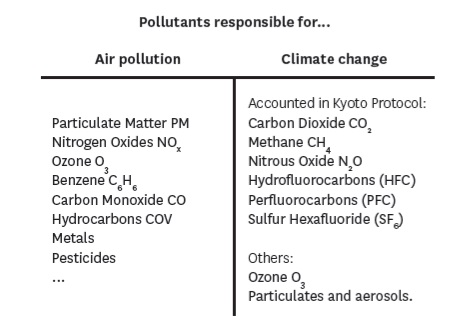
Air pollutants and greenhouse gases are different gases with different consequences, particularly in terms of health implications: the former have direct effects which lead to various pathologies and premature deaths, the latter do not (see Table 1). For example, CO2 is not directly harmful to humans, whereas nitrogen oxides (NOx), fine particulates, and ozone (O3) are particularly dangerous in terms of public health. Air pollution has become the world’ s 4th leading cause of death at around 6.67 million deaths per year behind hypertension, tobacco, and dietary risks 22 . In the first half of 2020, 49,000 deaths were attributed to air pollution in Beijing and Shanghai alone 23 .
The confusion between these different gases no doubt stems from the fact that the sources of greenhouse gases also emit air pollutants. This is especially the case for the combustion of fossil fuels which is responsible for more than half of the world’s greenhouse gas emissions 24 as well as many other air pollutants. However, all these pollutants are different, not only in terms of their consequences (local or global) and how long they remain in the atmosphere 25 , but also in terms of the technologies that can be used to limit them. There are a large number of so-called pollution control technologies which differ according to the type of pollutant targeted. For example, some technologies aim to improve the efficiency of the combustion process, thereby reducing the emissions generated per kWh produced (for example, burners that emit low quantities of NOx to increase combustion efficiency). Others are designed to treat flue gas by capturing substances before they are emitted into the air and storing them (e.g., enhanced mercury particle control filters flue gas to capture mercury particles generated during coal combustion). Since the 1970s, a number of SO2 and NOx control technologies have been developed in the United States, Europe, and Japan.
Table 1 • Some air pollutants and greenhouse gases
Carbon Capture and Sequestration (CCS) technology only aims to capture the CO2 emitted during the combustion of fossil fuels. Currently, this technology is not widely used, even in new thermal power plants, because of its high cost 26 .
Water Pollution in China
In terms of premature deaths, air pollution problems have become more important than water pollution problems in China 27 . However, the quality and quantity of water remain a concern due to rapid urbanization and the importance of the country’s industrial sector. The main sources of pollution are urban and industrial wastewater, but also the massive use of fertilizers and pesticides by the Chinese agricultural sector 28 .
To oversee water quality, several hundred stations monitor 318 rivers and 26 lakes in the country’s 9 river basins. All stations are monitored on a monthly basis under the authority of the MEE. Samples are analyzed for eleven parameters (water temperature, pH, etc.), several of which are used to assess the degree of pollution 29 . Each sample is classified into one of six following water quality categories according to its concentration of different pollutants:
- Category I: water usable as a source of drinking water (i.e., usable without treatment) and, at the national level, for nature reserves;
- Categories II and III: Water that may be used as a Class A or B source of water for centralized drinking water supply, rare fish species sanctuaries, and fish and shellfish spawning grounds;
- Category IV: water that can be used as a general industrial and recreational water source without direct human contact with the water;
- Category V: water suitable only for agriculture and general landscaping;
- Category V+: water unfit for any purpose.
Figure 3 • surface water classification 30
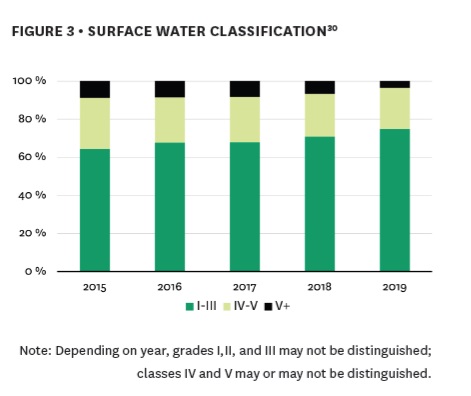
Note: Depending on year, grades I,II, and III may not be distinguished; classes IV and V may or may not be distinguished.
Each year, the MEE publishes data on the quality of surface water, lakes, and groundwater. Figure 3 shows the results for all the samples taken for the 9 basins in the country. Since 2015, there has been a slight and steady decline in the percentage of withdrawals of grade IV and above.
The situation is in fact very different depending on the basin. Figure 4 shows two very different examples. Withdrawals below grade IV in the Pearl River basin are relatively small, although in the last two years the percentage has increased slightly. In contrast, water quality in the Haihe River is worse, with about half of the samples below grade IV.
Figure 4 • surface water classification for two bassins: haihe river (above) and pearl river (below) 31
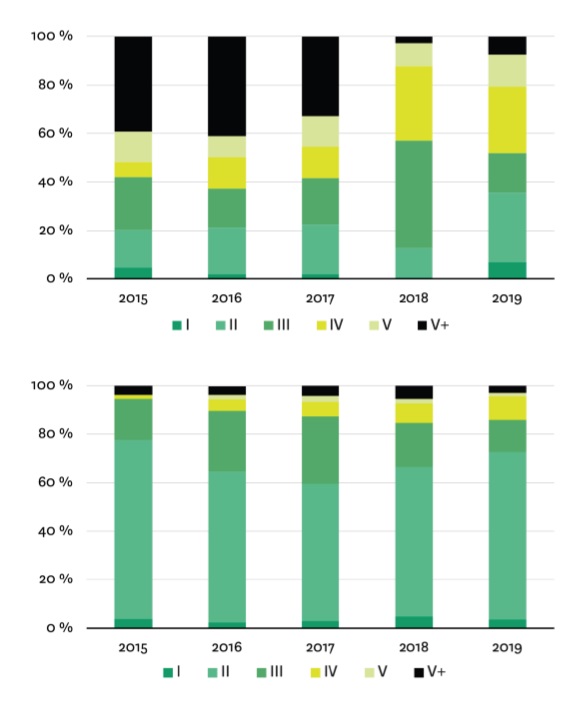
Note: Between 2017 and 2018, the percentage of samples classified as V+ greatly decreased while the percentage of IV greatly increased. The report offers no explanation for these significant changes.
The Asia Society Policy Institute (2020, 2021) 32 uses MEE data to construct a surface water quality indicator for the freshwater system that includes the Yangtze, Yellow, Pearl, Songhua, Huai, Hai, Liao, and Zhejiang-Fujian River basins. Their analysis tracks the evolution of this indicator since the third quarter of 2014. A slight improvement is measurable since that date, but the results remain quite fragile; for example, there is a marked decline in quality in the third quarter of 2019, especially for the Huang River.
Soil pollution in China
Because of the famine caused by Mao’s Great Leap Forward (1958-1962), which killed tens of millions of people, food security has been a priority for the Chinese authorities since the 1950s. This goal has led to the continuous increase in the area of agricultural land, which has sometimes resulted in the cultivation of land near mines or industrial facilities.
Since the late 2000s, a decade after the victory of the communists, several health scandals have affected the country, including the discovery of dangerous levels of heavy metals in some food products, causing widespread public outcry 33 . In 2013, for instance, Guangzhou food safety officials found cadmium in several rice samples. The Ministry of Environmental Protection estimates that heavy metal contamination affects 12 million tons of grain each year (about 2% of China’s grain production), which is enough to feed 24 million people annually 34 .
Started in 2005, but only published in 2014, a national soil pollution survey has been jointly conducted by the Ministry of Environmental Protection and the Ministry of Land and Resources of China. Previously, there were no official statistics on the state of its soil. The findings are particularly concerning: 16% of surveyed soils were classified as polluted beyond acceptable standards, and heavy metal contamination reached 19.4% of total arable land 35 . The geographical distribution of the results was not published, but the findings revealed that pollution in southern China is more severe than in the north. The Yangtze River and Pearl River deltas, as well as northeastern China, are polluted due to the widespread presence of heavy industry. Levels of heavy metal concentration are particularly high in the southwest and south-central regions, which are the main regions for metal mining and smelting. In 2014, Wang Shiyuan, China’s Vice-Minister of Land and Resources, announced that about 3.33 million hectares of farmland were too polluted to be cultivated, an area slightly larger than Belgium. The authorities have banned all agricultural production on these lands to prevent toxic metals from entering the food chain.
As with air and water, the quality of 1550 billion mu of permanent agricultural land was assessed nationwide by the MEE according to 10 categories 36 with category 1 being the best and category 10 the worst. At the end of 2019, the average quality was assessed at 4.76: 31.24% of the total was classified in categories I to III, 46.81% in categories IV to VI and 21.95% 37 . This shows a slight improvement in the quality of arable land: the average quality was 5.09 in 2017 with 27.4% for categories I to III, 45% for IV-VI and 27.6% of poor-quality land.
What results have been achieved since China went to war on pollution?
It is not easy to draw a clear conclusion about the state of the environment in China as results for air, water, and soil quality vary across regions.
Environmental quality is improving in some areas (air quality in Beijing) and deteriorating in others (water quality of the Haihe River) but pollution levels, especially air pollution, remain far above WHO standards, making pollution a major public health issue in China. The war on pollution thus seems far from won. Yet, in September 2019, Prime Minister Li Keqiang reaffirmed that economic development must remain the country’s primary goal, and the CCP head of the Ministry of Ecology and the Environment admitted that while environmental degradation remains a concern in China, the urgency of stimulating local economic growth only makes it more difficult to maintain environmental protection efforts 38 .
Notes
- [ndlr] See the article of S. Monjon et É. René titled “The New Tools of Environmental Governance in China: Top Down Control and Environmental Credit”, page 127.
- [ndlr] Ibid.
- Z. A. Wendling, J. W. Emerson, A. de Sherbinin, D. C. Esty, et al, 2020 Environmental Performance Index, New Haven, CT: Yale Center for Environmental Law & Policy, 2020. Since 2006, this indicator is published every two years.
- The “air quality” category of the 2020 EPI contains 3 indicators: population exposure to PM2.5 (55%), household use of solid fuels (40%), population exposure to ozone (5%).
- The “heavy metals” category only considers the population’s exposure to lead.
- The “ecosystem services” category contains 3 indicators: loss of forest area (90%), loss of grassland area (5%) and loss of wetland area (5%). These 3 indicators are calculated by taking averages over the last 5 years and comparing the areas to their level in 2000 for forests and 1992 for grasslands and wetlands.
- The “climate change” category contains 8 indicators including: the rate of increase of CO2, CH4, NO2 emissions and the rate of increase of the greenhouse gas intensity of GDP.
- The “pollution emissions” category contains 2 indicators: the rate of increase of SO2 and NOx emissions.
- Extract from EPI 2020 report: “better data collection, reporting, and verification across a range of environmental issues are urgently needed.” Wendling, Z.A., Emerson, J.W., de Sherbinin, A., Esty, D.C., et al. (2020). 2020 Environmental Performance Index.
- “The air quality in China has worsened in recent decades. From 1960 to 1979, the number of fog and haze days during winter in China showed a gradual upward trend. Although it was generally stable it grew rapidly since 2000”. H.-J. Wang, H.-P. Chen, “Understanding the recent trend of haze pollution in eastern China: Roles of climate change”, Atmos. Chem. Phys., 2016.
- Rohde R. & R. Muller, “Air Pollution in China : Mapping of Concentrations and Sources”, Plos One, 2015.
- For example, in 2014, Prime Minister Li Keqiang declared “war on pollution” at the annual CCP conference. The year 2013 saw a significant strengthening of China’s air quality improvement policies with the launch of the National Air Quality Plan which set reduction targets to be achieved by 2017, including a minimum 10% reduction in all urban areas in PM10 concentrations compared to 2012 levels. Additional measures have been implemented in these areas including a ban on the construction of coal-fired power plants, a reduction in the number of cars on the road, and a reduction in industrial capacity for steel and iron production. M. Greenstone, P. Schwarz, Air Quality Life Index – Is China winning its war on pollution? Energy Policy Institute at the University of Chicago, 2018.
- These 74 cities are all larger than a prefectural city (minimum 250,000 non-rural inhabitants according to Chinese standards) and received special monitoring. These cities are specifically located in three densely populated regions of China which are the Beijing-Tianjin-Hebei region (one of the most polluted regions of China in 2013),the Yangtze River Delta, and the Pearl River Delta. These three regions were specifically targeted in 2013 by the National Air Quality Plan.
- O3 is formed by the reaction of NOx produced mainly by road traffic and VOCs produced mainly by industrial activities, solvents and paints, and road traffic. www.airparif.asso.fr/lozone, accessed on 25/02/2021
- Guangzhou City and the Fenwei Plain region were not included because data is only available for two years during the 2015-2019 period.
- Sources : Ministry of Environmental Protection, 2015 and 2016 Report on the State of the Environment in China, The People’s Republic of China. Ministry of Ecology and Environment, 2017, 2018 and 2019 Report on the State of the Ecology and Environment in China, The People’s Republic of China.
- Tsinghua University, Health Effects Institute, Air pollution from coal a major source of health burden in China, 2016.
- Y. Xu, “Environmental Policy and Air Pollution in China : Governance and Strategy”, Routledge Studies in Environmental Policy, 2021.
- Global Energy Monitor, “China Dominates 2020 Coal Plant Development”, février 2021.
- Air Quality Life Index, “China Fact Sheet”, 2020.
- “Did China air quality improve in 2019?”, Smart Air Filters, 2020.
- Health Effects Institute, State of Global Air 2020. Special Report, Health Effects Institute, 2020.
- Reuters Staff, “ Smog causes an estimated 49,000 deaths in Beijing, Shanghai in 2020 – tracker ”, Reuters, 2020.
- United-States EPA, Global Grennhouse Gas Emission Data.
- Aerosols and particles remain suspended in the atmosphere for a short time, about one day to one week, while GHGs remain there for a longer period. CO2, for example, requires a period of hundreds to thousands of years for it to be absorbed from the air by other reservoirs: ocean, biomass, soil, etc.
- Climate Change, “Capture et séquestration du carbone. Une solution qui peine à se concrétiser” Observatoire mondial de l’action climatique non-étatique, 2018.
- The Institute for Health Metrics and Evaluation (IHME), China data, University of Washington.
- B. Sun et al., “ Agricultural Non-Point Source Pollution in China: Causes and Mitigation Measures ”, Ambio, 41, 2012.
- The main pollutant responsible for the poor ranking of a water sample is NH3-N (due to fertilizer runoff, but also to wastewater treatment plant discharges and septic tank overflow); added to this are biochemical oxygen demand (BOD) and chemical oxygen demand (COD)-both of which are more closely related to discharges from human and animal wastes and some industrial activities.
- Sources : Ministry of Environmental Protection, 2015 and 2016. Report on the State of the Environment in China, The People’s Republic of China. Ministry of Ecology and Environment, 2017, 2018 and 2019. Report on the State of the Ecology and Environment in China, The People’s Republic of China.
- Sources : Ministry of Environmental Protection, op. cit.
- Asia Society Policy Institute, China Dashboard Winter 2020.
- In 2011, millions of hectares of farmland and 12 million tons of Chinese rice were contaminated with cadmium, a carcinogenic heavy metal. In 2016, China recorded more than 500,000 violations of food standards ranging from rice contaminated with heavy metals to lotions for infants containing lethal levels of industrial chemicals. Reuters, 2016.
- Goldman Sachs Global Investment Research, “China’s environment : big issues, accelerating effort, ample opportunities”, July 2015.
- China Council for International Cooperation on Environment and Development (CCICED), “Special policy study on soil pollution management”, 2016.
- Mu is a unit of area measurement used in China corresponding to about 1/15 of a hectare, or about 666.67 m2.
- Report on the State of the Ecology and the Environment in China, 2019, Ministry of Ecology and Environment, the People’s Republic of China.
- Time, “The Environmental Challenges of China’s Recovery After Covid-19”, consulté le June 2 2021.
citer l'article
Stéphanie Monjon, Léa Boudinet, The State of China’s Environment: What Has Changed in the Past Few Years?, Sep 2021, 128-133.
à lire dans cette issue
voir toute la revueEconomic Growth and Climate Change — Beijing’s Hard Choices
China’s emergence as a global economic power in recent years was accompanied by a growing role on the global climate stage. But this was not necessarily obvious since the fight against climate change has not always been one of Beijing’s priorities and may even appear to contradict its national objectives. First, in terms of growth, … Continued
lire l'articleCan the EU Lead the Fight Against Climate Change?
Adam Tooze — In light of the important compromises reached last December on Europe’s new goal to reduce carbon gas emissions by 55% by 2030, I would first like to ask Enrico and Laurence how they view the development of Europe’s climate policy since the inauguration of the Green Deal. Enrico Letta — Last spring … Continued
lire l'articleThe EU and China: Climate and Trade Increasingly Intertwined
The EU and China – different ambitions and actions on climate The interlinkages between trade and climate change have risen to the top of the international negotiations on climate cooperation. This effect is partly caused by the Green Deal of the European Commission, by the revival of international climate and trade talks after the US … Continued
lire l'article